


Publications
2020
- Laura Koesten, Kathleen Gregory, Paul Groth, Elena Simperl. “Talking datasets: Understanding data sensemaking behaviours”. Revision stage in International Journal of Human-Computer Studies
- Laura Koesten, Pavlos Vougiouklis, Elena Simperl, Paul Groth. “Dataset Reuse: Translating Principles to Practice” Conditionally accepted at Patterns – Cell Press Journal
- Pavlos Vougiouklis, Leslie Carr, Elena Simperl. “Pie Chart or Pizza: Identifying Chart Types and Their Virality on Twitter” Proceedings of the International AAAI Conference on Web and Social Media
2019
- Koesten, Laura, Emilia Kacprzak, Jeni Tennison, and Elena Simperl. “Collaborative Practices with Structured Data: Do Tools Support What Users Need?.” In Proceedings of the 2019 CHI Conference on Human Factors in Computing Systems, p. 100. ACM, 2019.
- Koesten, Laura, Elena Simperl, Emilia Kacprzak, Tom Blount, and Jeni Tennison. “Everything you always wanted to know about a dataset: studies in data summarisation.” International Journal of Human-Computer Studies
2018
- Groth, Paul, Laura Koesten, Philipp Mayr, Maarten De Rijke, and Elena Simperl. “DATA: SEARCH’18–Searching Data on the Web.” arXiv preprint arXiv:1805.11883 (2018).
- Kacprzak, Emilia, José M. Giménez-García, Alessandro Piscopo, Laura Koesten, Luis-Daniel Ibáñez, Jeni Tennison, and Elena Simperl. “Making sense of numerical data-semantic labelling of web tables.” In European Knowledge Acquisition Workshop, pp. 163-178. Springer, Cham, 2018.
- Kacprzak, Emilia, Laura Koesten, Jeni Tennison, and Elena Simperl. “Characterising Dataset Search Queries.” In Companion of the The Web Conference 2018 on The Web Conference 2018, pp. 1485-1488. International World Wide Web Conferences Steering Committee, 2018.
- Kacprzak, Emilia, Laura Koesten, Luis-Daniel Ibáñez, Tom Blount, Jeni Tennison, and Elena Simperl. “Characterising dataset search—An analysis of search logs and data requests.” Journal of Web Semantics 55 (2019): 37-55.
- Koesten, Laura, Elena Demidova, Vadim Savenkov, John Breslin, Oscar Corcho, Stefan Dietze, and Elena Simperl. “PROFILES & DATA: SEARCH International Workshop on Profiling and Searching Data on the Web Chairs’ Welcome & Organization.” In Companion of the The Web Conference 2018 on The Web Conference 2018, pp. 1479-1480. International World Wide Web Conferences Steering Committee, 2018.
Presentations/Talks
Visual summaries

Software
Datatset Summarisation Tool Prototype
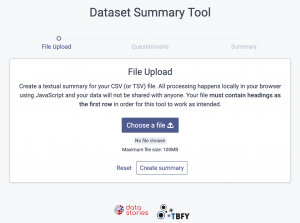
This prototype dataset summarisation tool is based on research on creating more useful dataset summaries. The aim is to help and guide publishers through the process of writing a meaningful dataset summary so that other people can make sense of the dataset before downloading it. Imagine searching for data and seeing a text summary that tells you what you need to know!
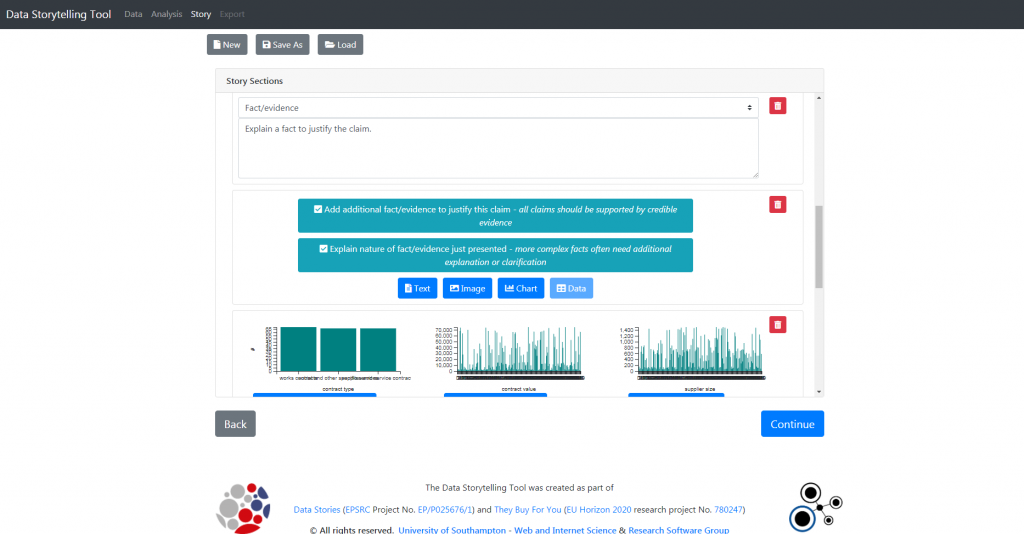
Data Storytelling Tool
The Data Storytelling Tool is designed to assist authors of data-stories, including data journalists, managers, auditors, and activists, in telling stories with data. Users can load their own datasets (which, for privacy reasons, will never leave their own machine) to browse and analyse the data. The tool will then help them plan out a story structure, suggesting areas of the data that may be of interest to their audience, before exporting it to one of several formats.
Piechart or Pizza?
This tool is part of our work in which we seek to learn to identify images of charts as they are posted on social media. We have adapted the VGGNet architecture proposed by Simonyan and Zisserman to the requirements of our chart identification problem. The system is trained on a dataset consisting of chart images from the ReVision corpus and general-purpose images from ILSVRC-2012.
You can use our pre-trained model to identify whether an image on the web displays a data visualisation or not. In case it does, our model will try to predict the depicted chart type.