

Data Stories in Summary
We have summarised some of the work done in the Data Stories project in a short and simple animation video:
Dataset Search and Retrieval
A key part of this project is enabling the public to use open data to help inform their daily lives. To do this means supporting users in finding useful and relevant data to their task at hand.
Dataset search is fundamentally different to the now familiar way in which we search for documents on the web; to accurately retrieve the most useful information, data publishers rely heavily on authors providing meta-data about their published datasets.
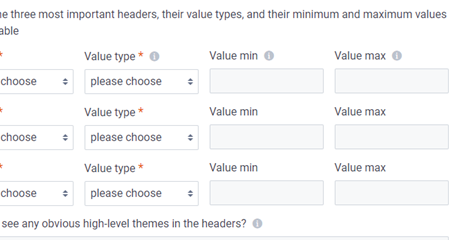
To aid them in this, we are working towards creating tools that automatically generate summaries of datasets, and provide authors with a sensible template for describing their data.
Playable Data
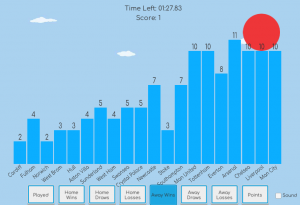
Bar Chart Ball is a data-game based on the work of Julian Togelius ; players have to navigate the bar chart by changing the attribute displayed. Does this help people remember what data they’ve seen? Play it for yourself and find out!
Supporting Data Journalists
When people tell stories with data, they are often trying to sway an audience to a particular conclusion. Data journalists frequently use narrative tropes in combination with the raw data to help explain their argument to their audience, and guide them towards their conclusion.
We will be supporting this by developing tools that provide a narrative template to data journalists, that can recommend helpful ways of visualising the underlying data, and allow them to validate their hypothesis and conclusions.
Detecting Data on the (Social) Web
When people imagine seeing data on social media, what exactly are they picturing? A series of mysterious numbers? A link to a spreadsheet, or a report? Or some sort of animated visualisation? What even is a “data tweet”? By examining live social media data from a variety of platforms, we are collecting data on the sorts of data that people post about. We are also using advanced machine-learning techniques to identify and categorise different types of data visualisation, and their uses, on the social web.
“Viral” Data
How does data spread across social media? Are there certain features that make it more likely to go viral? We are in the process of collecting social media posts about data to not only determine what makes these “interesting” to a given audience, but also to train a machine-learning classifier to predict what sorts of data-posts spread the furthest and fastest.
Data As Culture/Data Perception
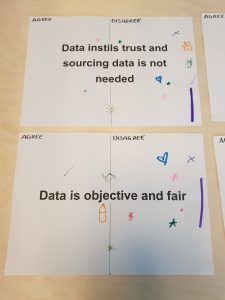
As part of our work on what data means to different communities, and how different communities interact with data that is relevant to them, we have partnered with the Tribes, Treasure Hunts & Truth Seekers event at Birmingham Open Media, which included a number of activities centering around “what makes you, you” and how that relates to the data we see in the world around us.
We want to find out not only what different demographics think of when we use the “term” data, but how they use it, directly or indirectly, and how it impacts their day-to-day lives.

Data Storytelling
Alongside fanSHEN, as part of the Vertigo STARTS artistic residency program, we will be helping to create a piece of artwork that tells a story using real-world data, allowing a group of players to solve puzzles and explore a mysterious world of whistle-blowers and espionage. Players must delve into the data, collaborate, and corroborate, to unravel the mystery.